Market Weather
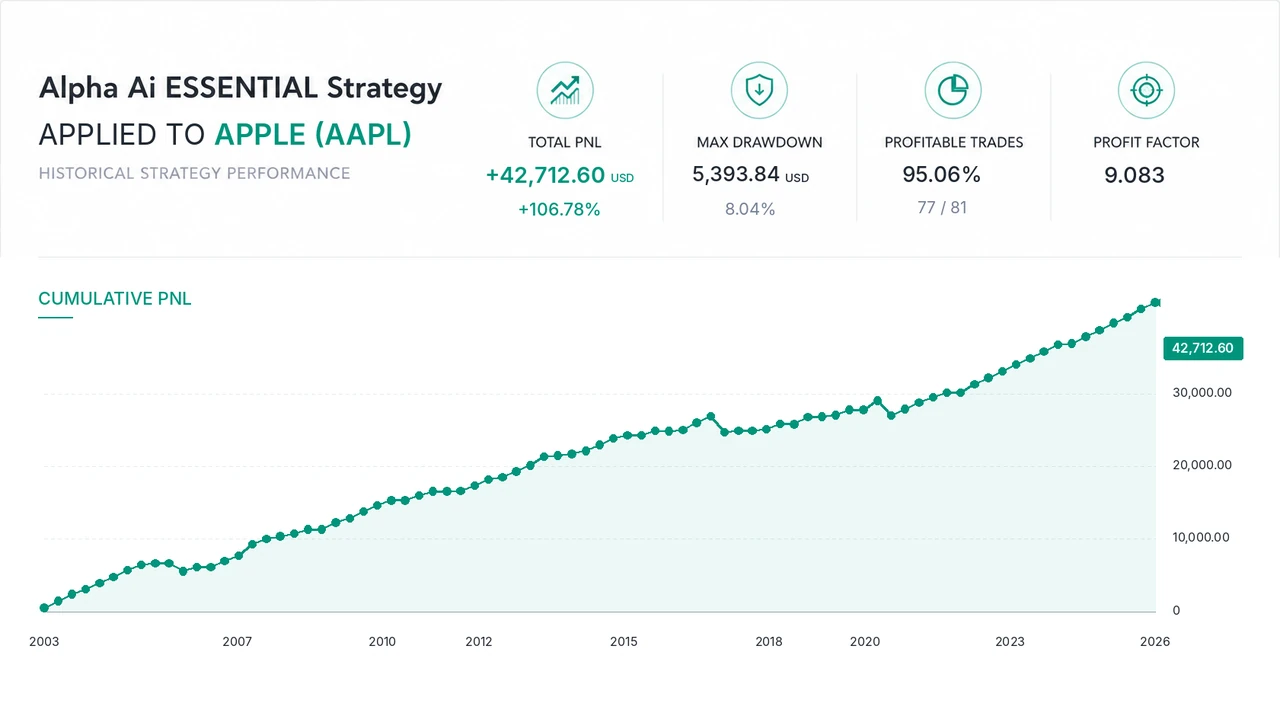
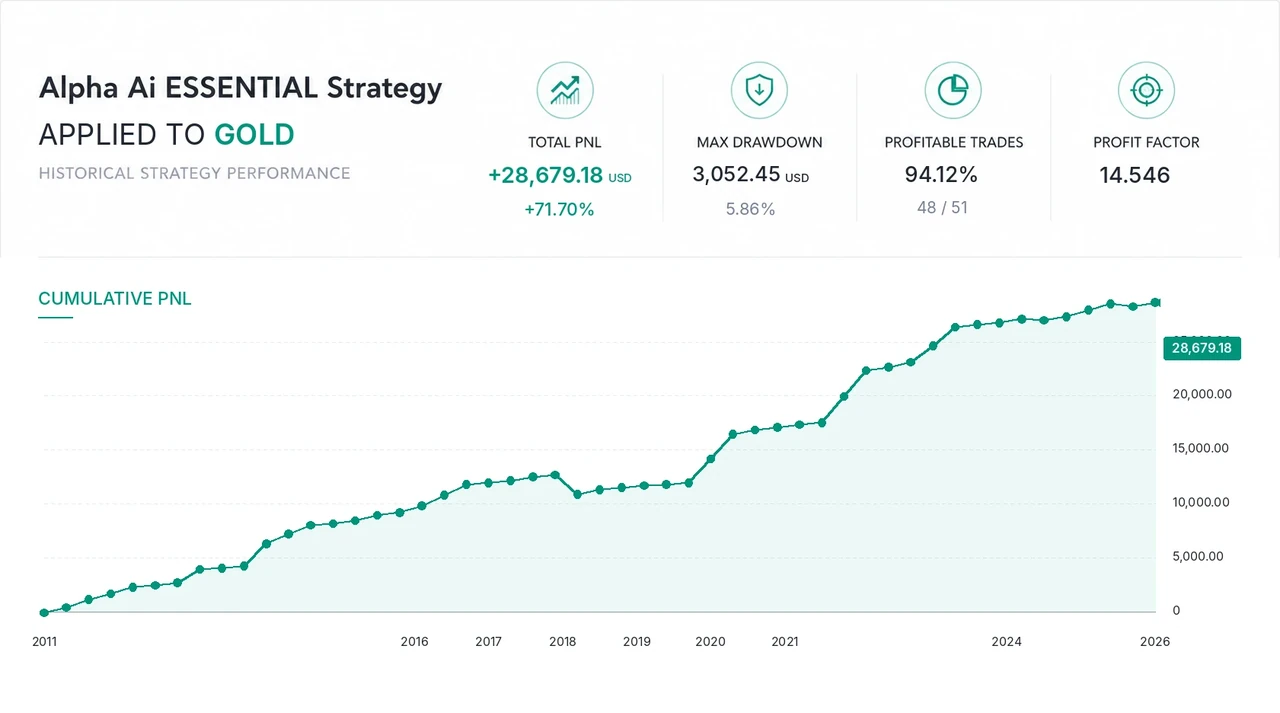
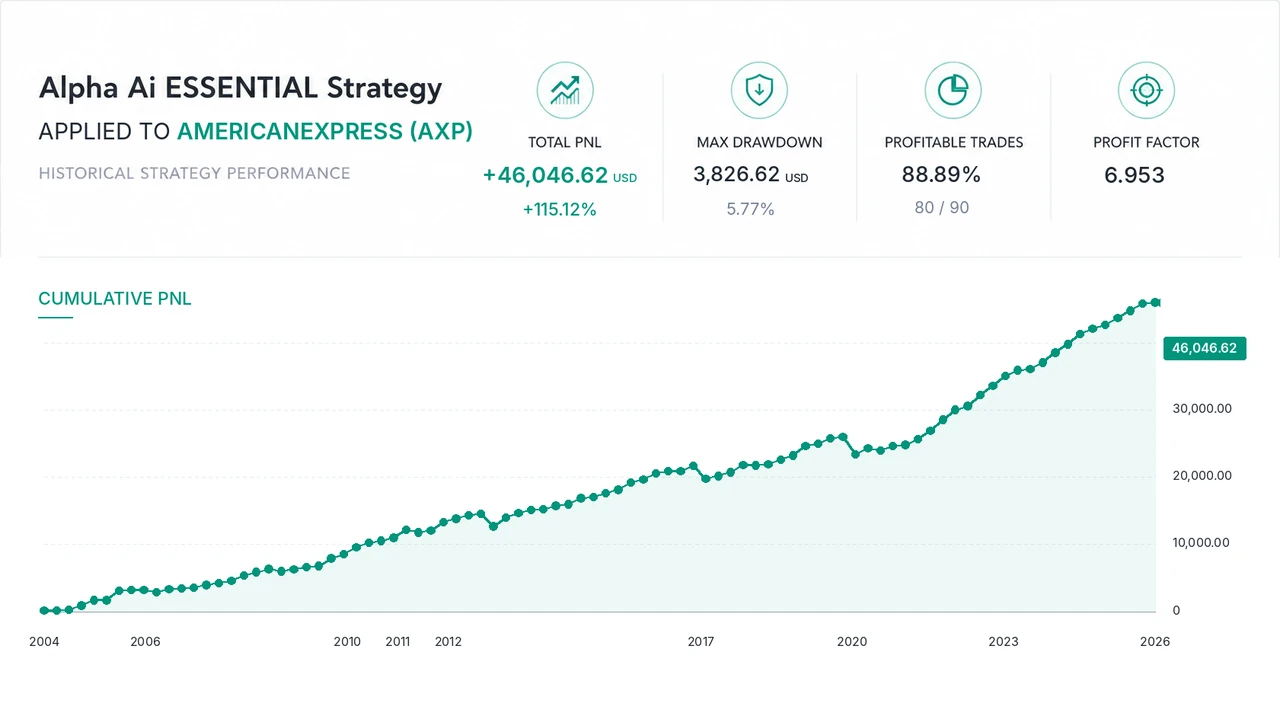
Historical US-market seasonality for the current calendar month, shown beside Alpha AI's current closed-trade performance.
Historical US Market Risk
Based on completed historical observations only. Alpha AI does not alter this score.
Alpha AI · Current Month
Current closed-trade performance.
Historical Market Profile
Completed historical observations only.
Historical Heatmap
Year-by-year completed market returns for this calendar month.
| Year | S&P 500 | Nasdaq-100 | Dow | US Market | Alpha AI |
|---|---|---|---|---|---|
| Loading heatmap… | |||||
How to Read These Results
Market-index returns and Alpha AI performance use different calculation methods. They are displayed together to provide market context, not as a direct benchmark-return comparison.
Calendar-month index return
S&P 500, Nasdaq-100 and Dow figures represent each index's percentage change from the previous month-end close to the current month-end close.
- One return per index for each completed calendar month.
- US Market is the equal-weight average of the three indices.
- Partial current months are excluded from the historical heatmap and seasonal averages.
Sum of closed-trade percentages
Alpha AI monthly performance is the arithmetic sum of the percentage result of every trade closed during that month, using a fixed position amount per trade. Results are not compounded and do not represent a fully invested portfolio return.
- Only closed trades are included in the monthly figure.
- Open positions are included only after they are closed.
- Multiple trades can occur across different assets during the same month.
Past performance does not guarantee future results. Trading involves risk and losses can occur. Historical market data, Alpha AI results and the Market Weather indicator are provided for informational and analytical purposes only. The Market Weather score reflects historical seasonality and is not a prediction of future market direction or a guarantee of future performance.