LATEST CLOSED TRADES

LIVE BROKER-CONNECTED trades since Jan 2025 — wins and losses included

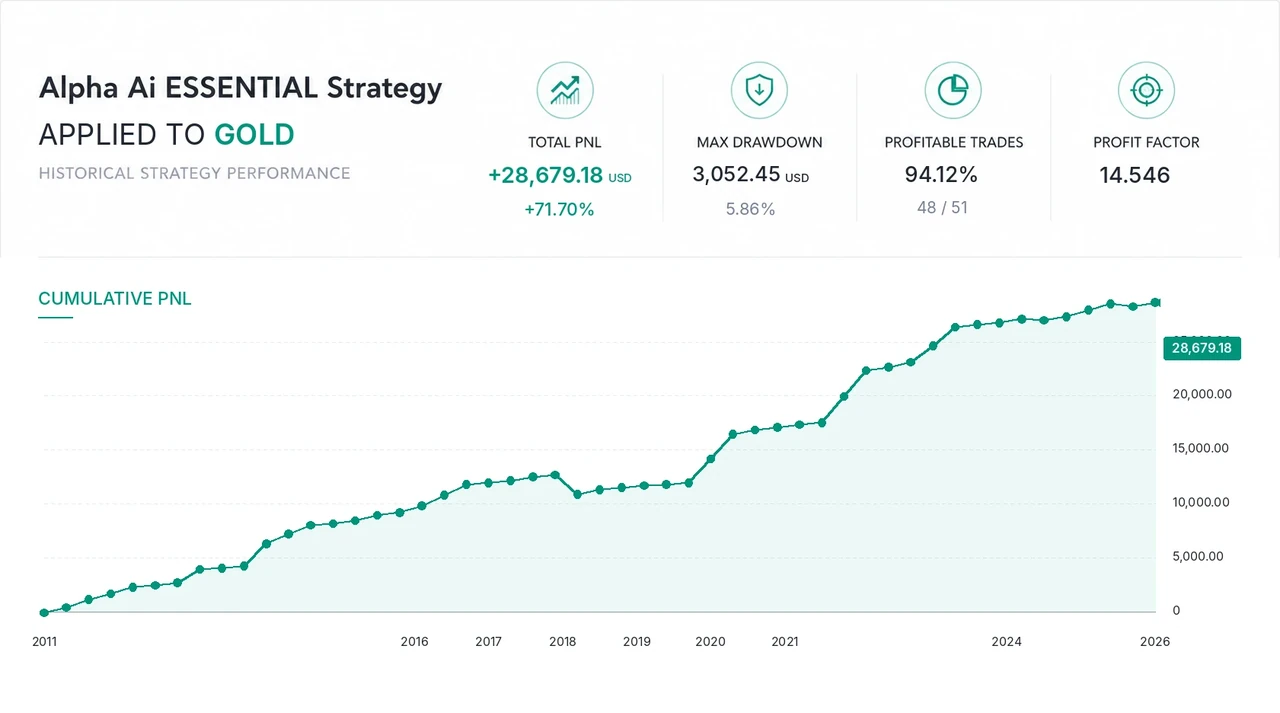
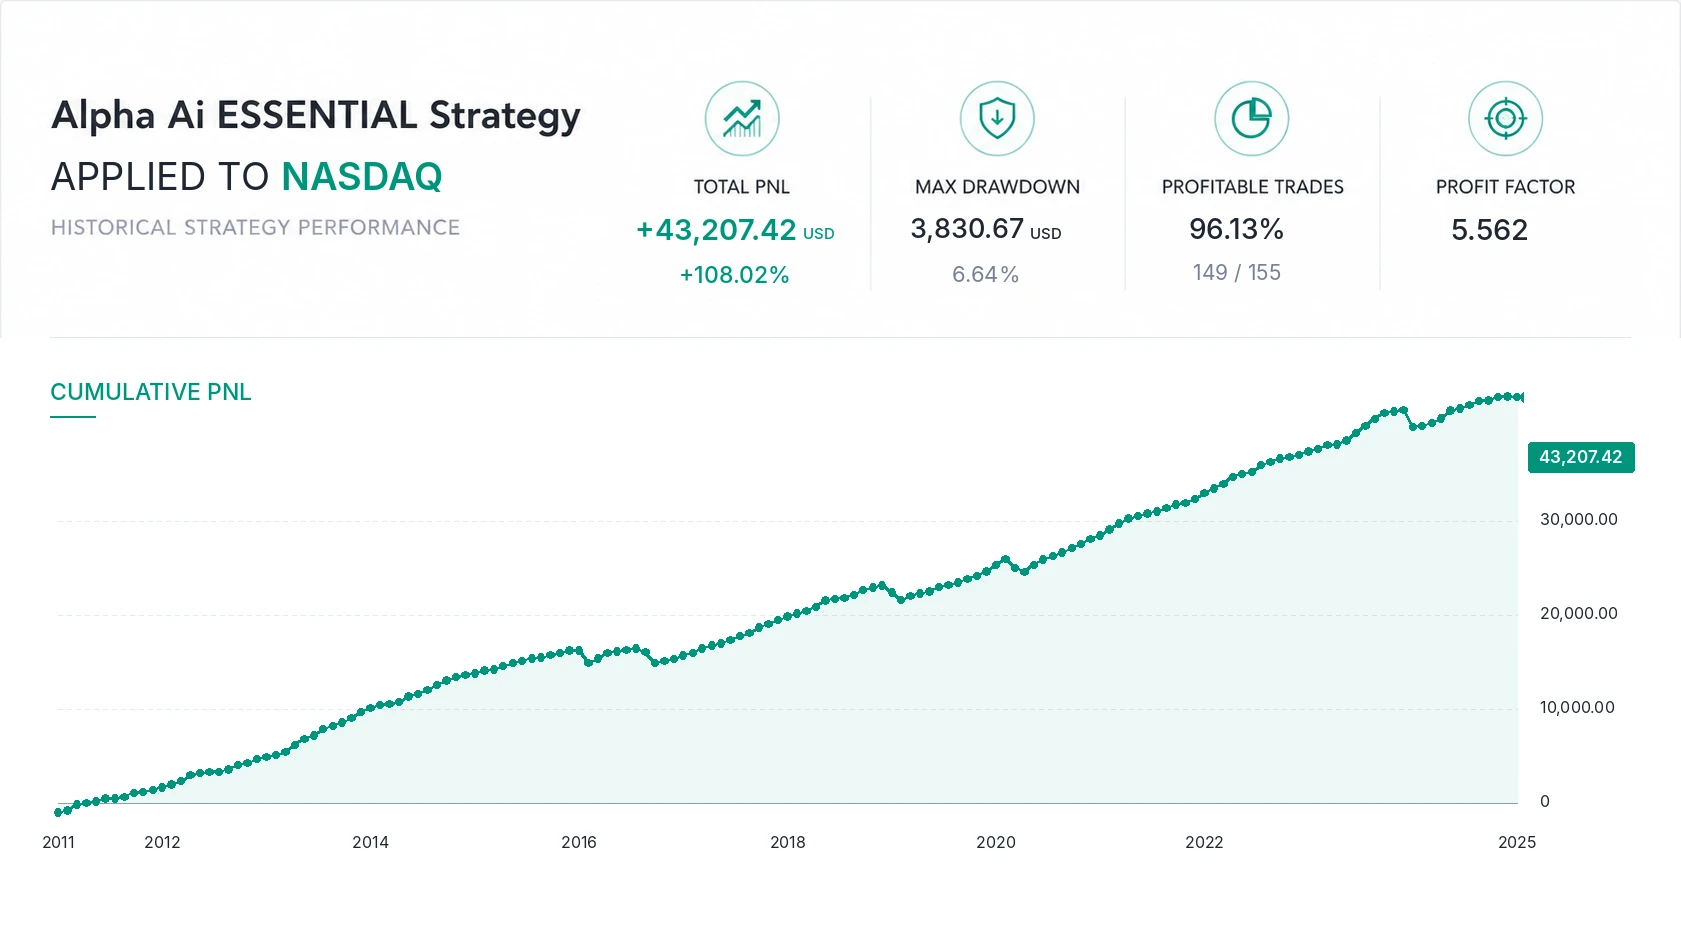
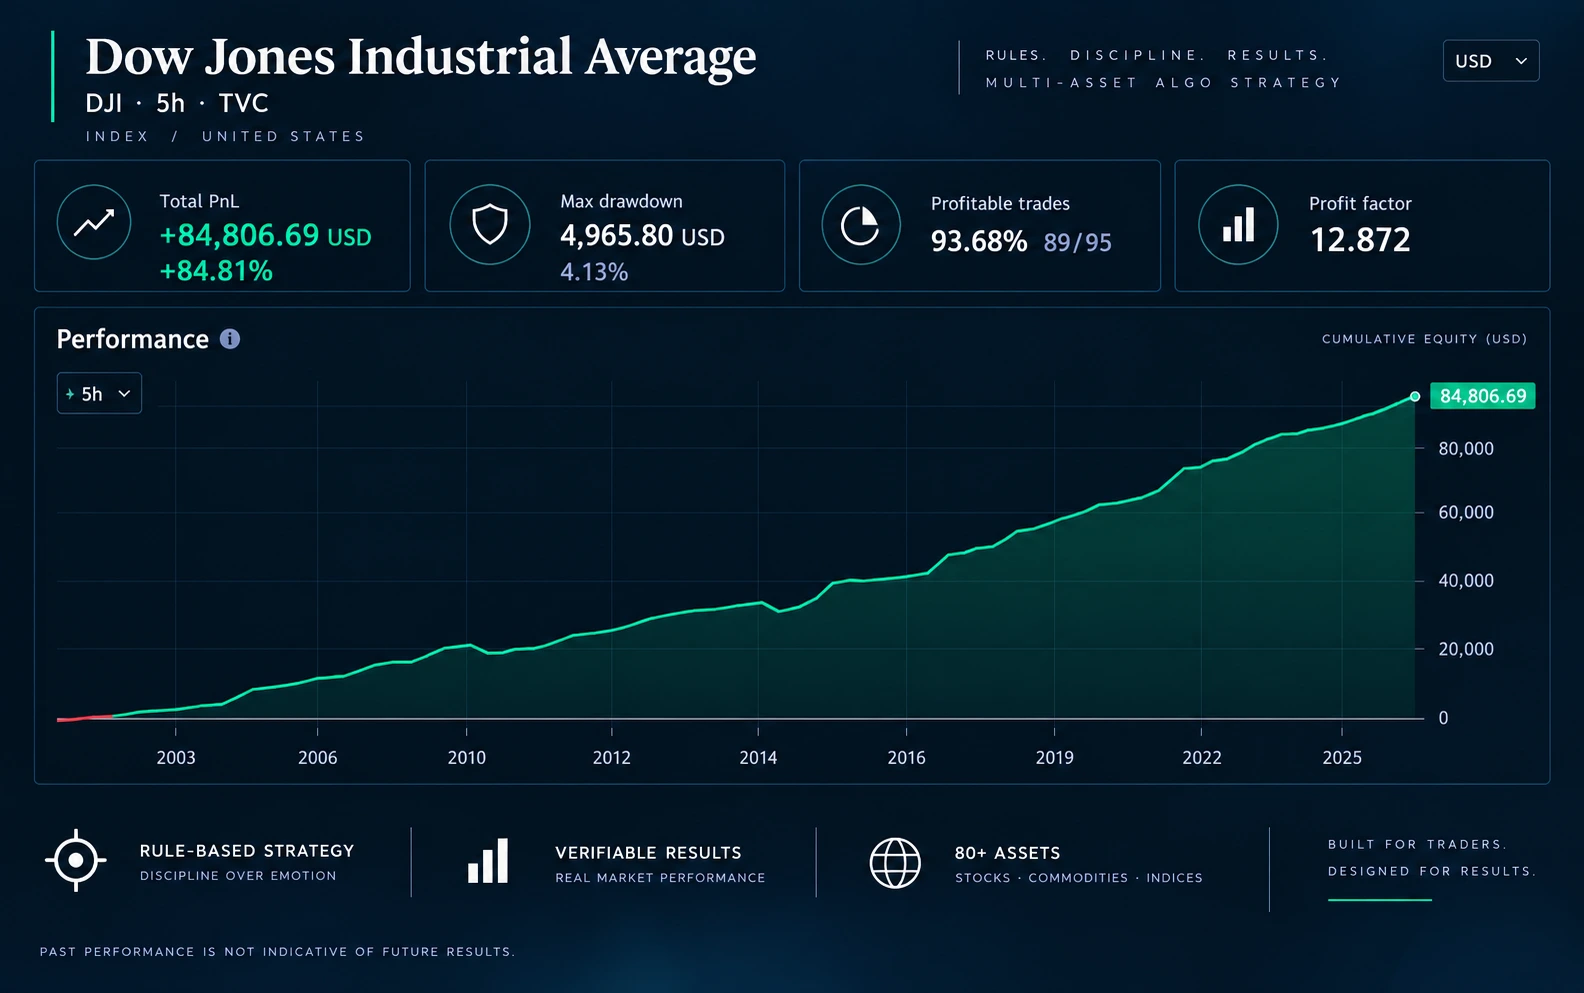
Performance Disclosure: Metrics blend hypothetical backtesting with verified live execution via the Capital.com API. Data since January 2025 reflects real-time, live trading. Prior data represents algorithmic backtesting, which has inherent limitations and does not represent actual live results. Past performance—whether simulated or live—is not indicative of future results and does not guarantee profitability.

Asset Coverage
Want the complete execution record?
Review Alpha AI’s public broker execution archive — including winning trades, losing trades and positions still open at each published statement cutoff.

ALPHA AI PERFORMANCE ACROSS MARKET CYCLES

Historical strategy results from 2000 onward, extended with recent Live trades results since January 2025

Cumulative Alpha AI Trade Results Across 84+ Markets

Historical Alpha AI strategy results, extended with recent live trades. Fixed position size per trade. Non-compounded

All wins & losses included Fixed position size Non-compounded results
This chart combines historical TradingView strategy results with recent trades executed through live account. Historical results are hypothetical. Recent trades are recorded execution results.

The cumulative line is calculated by adding each individual trade percentage using the same fixed position amount per trade. It is not compounded account growth.

Illustrative Account Balance — Fixed $4,000 per Trade

Starting with $20,000 and allocating the same fixed $4,000 position to every trade.

Fixed $4,000 per trade No compounding Illustrative scenario
This scenario applies the recorded percentage result of each trade to a fixed $4,000 position, starting from an illustrative $20,000 balance.

It combines historical strategy results with recent live trades. It does not represent the actual performance of either brokerage account and does not predict future account growth.

DON’T JUDGE A STRATEGY BY ONE GOOD YEAR.

See how Alpha AI tested quarter by quarter across different market environments.

Each percentage represents the sum of closed-trade returns for the period, with losses included — Check how % is calculated

Loading performance data...
Percentages shown represent the sum of individual closed-trade returns for the period, not compounded portfolio returns.

Hypothetical backtested performance + LIVE BROKER-CONNECTED TRADES since 01/2025 . Past results do not guarantee future live returns
TURN THESE RESULTS INTO A MORE DISCIPLINED TRADING PROCESS.
Access Alpha AI Reversal Pulse and follow one complete strategy from entry to exit across 84+ markets.

Disclaimer: Alpha Capital (operated by WideMena FZC, Building 8 - Dubai Media City - UAE. License No 95026) is a technology development company providing software tools, trading strategies, and educational content. Alpha Capital is not a registered broker-dealer, financial advisor, or asset manager. All trading strategies, indicators, and tools (including Alpha AI) are designed for technical analysis purposes only. Live performance tracking records reflect historical real-time data connected via Capital.com API since January 2025; past performance is never an indicator or guarantee of future live market returns.